Introduction and Motivations
Elm City Stories is an interactive video game developed by researchers at the play2PREVENT lab. It attempts to reduce risk of substance use and educate players (11-14 year olds) on sexual health. Players create an avatar and play through various mini-games that seek to model real-life situations and involve issues such as peer pressure.
For Datafest 2022, we were provided with a dataset of statistics that detailed player interaction with the game. Variables included things such as time spent on individual mini-games, the characteristics of avatars players created, the options players select for mini-games with options, and a variety of other stats. This was a huge dataset, with over two million rows and twenty-four columns. It basically couldn’t be opened on a laptop without partitioning in advance.
After doing some general statistical investigation, we decided to look at player engagement. The game itself is a rather boring one, and is akin to the workplace training questionnaires that we are forced to fill out on a yearly basis, so we were fairly interested in whether these 11-14 year old players were actually paying attention or just clicking buttons and getting through the game. We also wanted to know whether engagement with the game actually yielded results.
Results
We decided upon three in-game metrics to determine engagement: 1) time spent per action in the “Me Power” aspirational avatar creation (related to investment in game), 2) time spent per action in minigames, specifically the “It’s On minigame”, which involved choosing between three responses to a high-risk drug/sexual health situation (related to commitment to reading), and 3) we ran a sentiment analysis on these responses to get polarization scores for players (related to the choices players make).
Our initial hypothesis consisted of the following: Players who spent little time on avatar creation, spent little time in the “It’s On” mini-game, and selected answer options of high emotional valences (the most extreme actions) would be the least engaged, and thus would perform the worst on questionnaires involving drug/sexual health situations. Players who spent the most time on avatar creation, spent a longer time on the “It’s On” mini-game, and selected answer options with a mixture of emotional valences would be the most engaged, and would perform the best on questionnaires involving drug/sexual health situations.
We made over two hundred histograms of various event times to determine how player engagement in avatar creation and the mini-game change throughout the game across different metrics such as level and responses, which are summarized by the 3D histograms shown here.
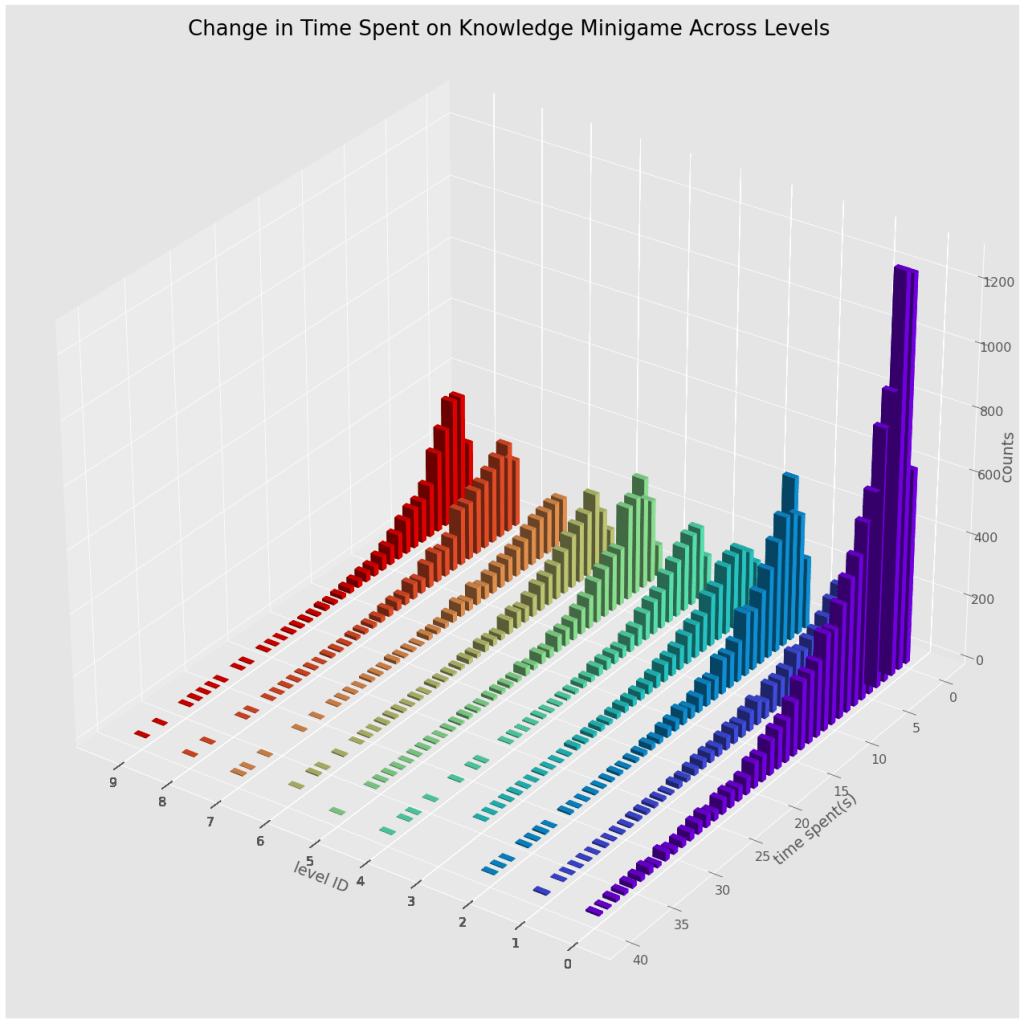
We found that although counts were decreasing, the engagement trends and distribution of response times remained the same as seen in the similar shape of these histograms, which are similar by any metric. From this, we decided that we can just take average times for these metrics. However, we needed an end result to compare these average times to in order to determine which of these metrics are proper signs of engagement.
To do this, we use the provided S5 scores. These scores are post-session surveys about the degree of confidence one has in dealing with a situation of drug use resistance. An example question would be “Your brother offers you drugs, how confident are you in refusing them?” “1: I can’t, 2: I don’t know if I can, 3: I can, 4: I can confidently refuse them”. Some of these questions are similar to situations in the game. These are the only “real-life” metric, and consist of a mean score (1-4) of 10 questions over multi-week period. Unfortunately, this dataset wasn’t very complete, so the number of sessions varied by player. To account for this, we decided so look at slope (week # vs score) to see the overall trend in player development as the participants played the game. The slopes are visualized below:
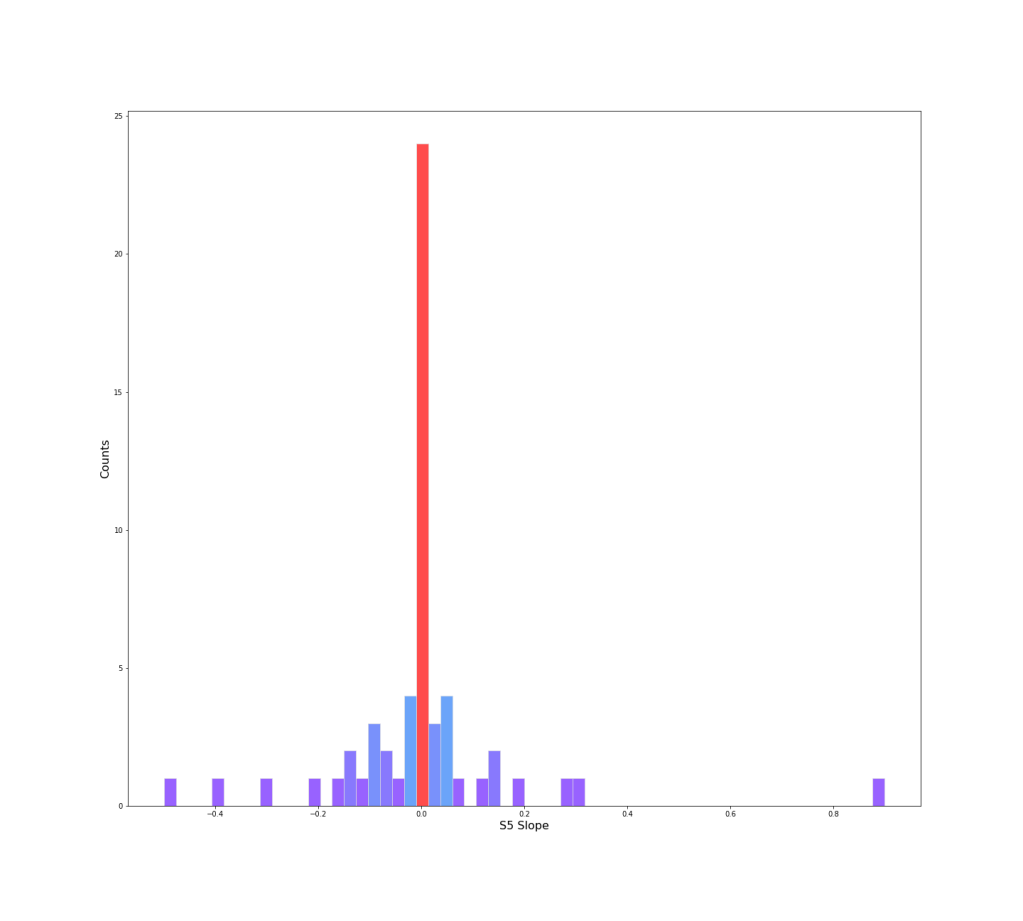
Of the 160 players, only 63 had S5 scores. Of these 63 S5 scores, we see that most of the slopes were 0, meaning the players had little changes in their responses.
We examine primarily wanted to examine correlations between the S5 mean (how players performed overall). We made the following correlation matrix:
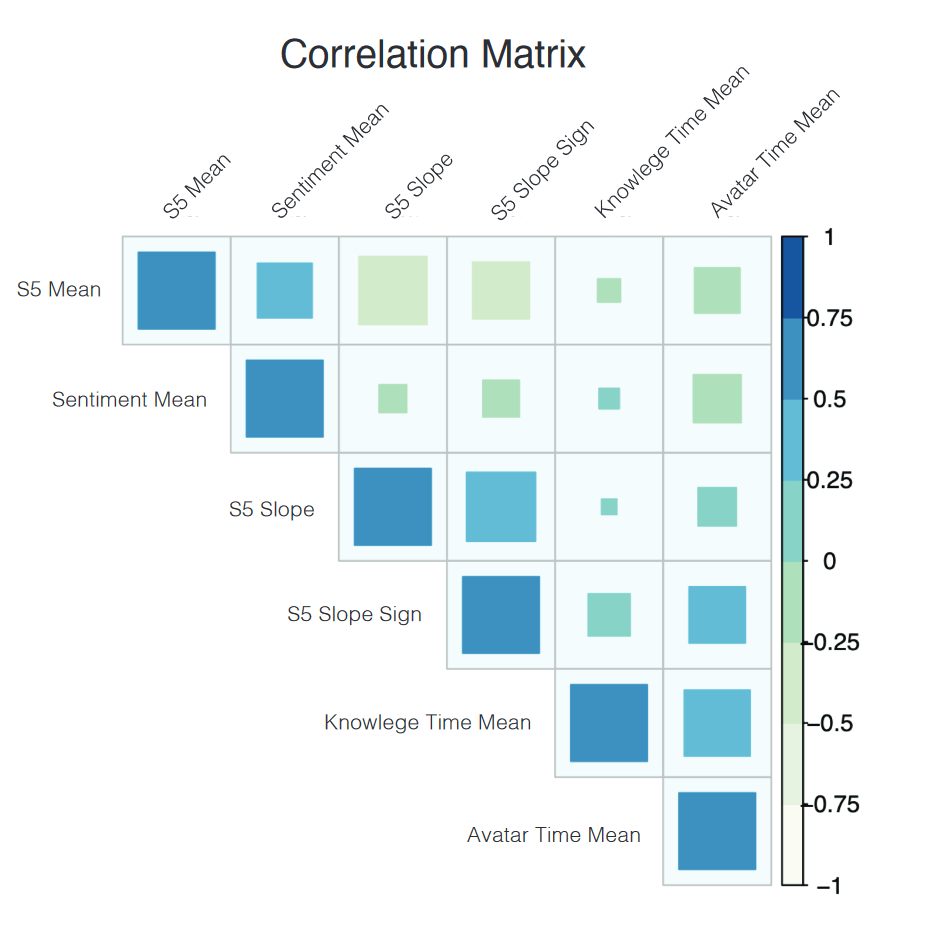
We deduce sentiments by performing sentiment analysis on the answer options players select for the “It’s On” mini-game. This sentiment analysis is performed with a BERT transformer trained on the IMDB movie dataset.
From this correlation matrix, we observe a lack of correlation between the avatar time mean (time spent in avatar creation), the knowledge game time mean (time spent in the “Its On” mini-game, the sentiment mean, and the S5 mean score. This could mean two things: the game itself is ineffective at teaching players how to act in at risk drug/sexual health situations, that the S5 scores were simply an ineffective metric, or a mix of both.
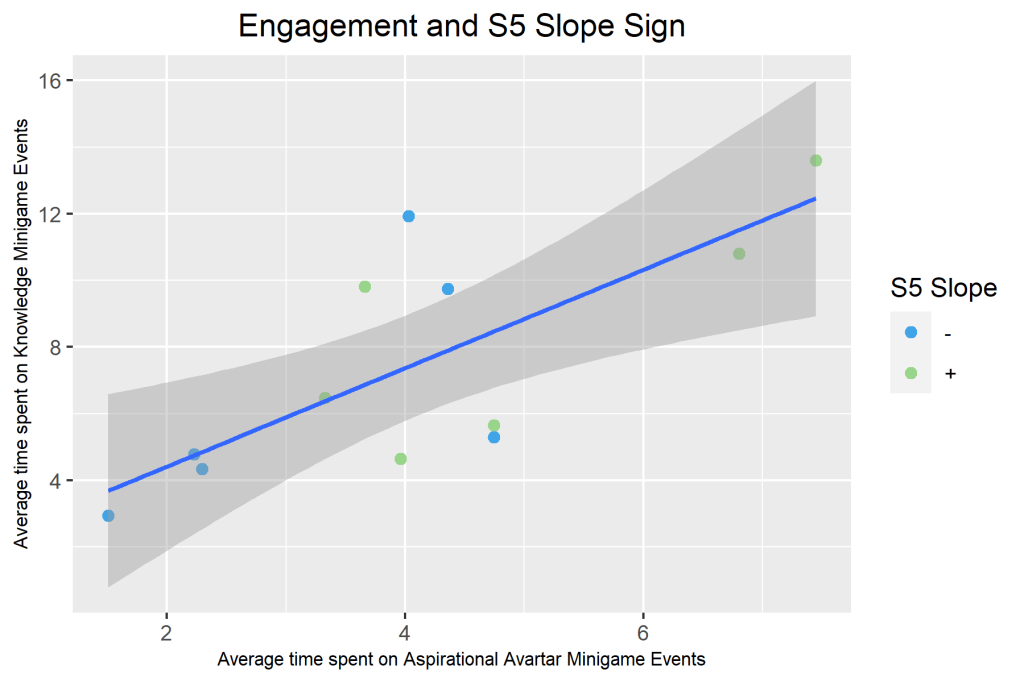
However, one interesting correlation we did notice in this instance was that the avatar mean time and knowledge game mean time were correlated, the avatar mean time and S5 slope + S5 slope sign were correlated, and the knowledge game mean time and S5 slope + S5 slope sign were correlated. Positively sloped S5 scores (players who gradually gained more confidence in the drug/sexual health scenarios presented by the S5 score) correspond to players who spent more time in the game (more elapsed time). Negatively sloped S5 scores (players who grew to have less confidence in dealing with situations) correspond to players who spent less time the in game (less elapsed time). It appeared that players who were more invested in their character (more time spent in avatar creation) and players who spent time answering questions in game were growing more confident in handling these situations with each successive session.
These outcomes lead us to conclude that the S5 score was possibly an ineffective metric. The first obvious fix that could be tried was to increase the amount of data. There were simply not that many S5 scores and this made it hard to come to concrete conclusions. It is also possible that the S5 is simply a bad questionnaire.It could be not actually informative of player knowledge/improvement as it is very easy to fly through without thought and without retaining any knowledge from game.
Another observation we made was that that higher scoring options (which are the correct answers) in the knowledge mini-game consistently correspond to higher weighted sentiment/polarity values. In fact, in some games, players needed to select the correct witty response with high polarity to move on. This raised a concerning question: Is the game telling participants that the “right” response is the most polarizing one? We felt that this could have significant and serious repercussions, which is something to keep in mind for future iterations of game design or questionnaires and surveys.

Leave a comment